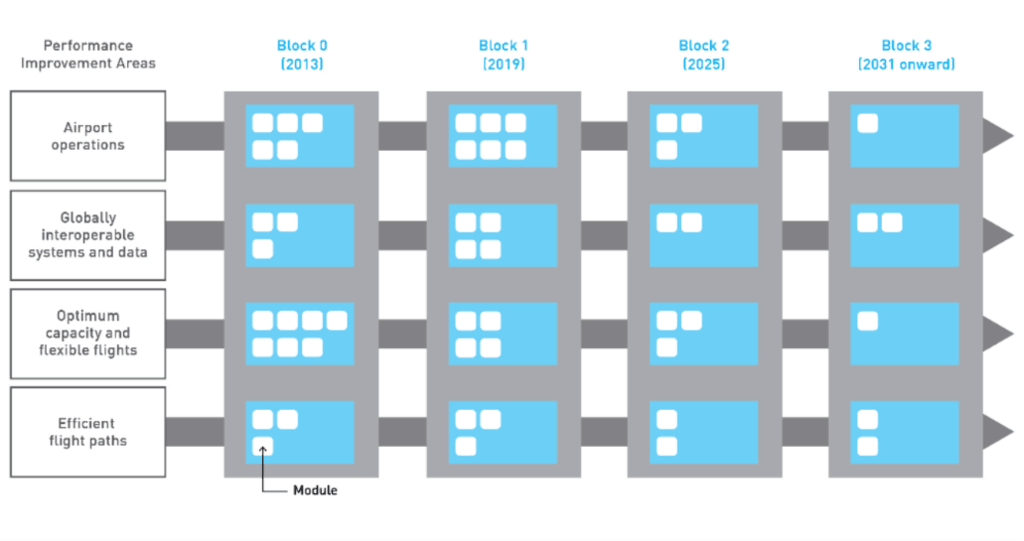
The ASBU framework was first introduced by ICAO at the 12th Air Navigation Conference in November 2012 to outline the strategy for modernising the global air navigation system. The framework includes a set of operational improvements that harmonise avionic capabilities and the required air traffic management (ATM) ground infrastructure, as well as automation. These efforts will improve the efficiencies of the global system, ensuring global interoperability.
ICAO has estimated that in Europe, by 2025, the yearly fuel-saving benefits that will arise from the planned implementation of ASBU Block 0/1 operational improvements, are equivalent to between 183 – 318kg per flight over the non-ASBU baseline. ICAO also estimates that yearly fuel savings in Europe will be between 1.95 – 3.35 million tonnes (6.15 – 10.6 million tonnes CO2 savings) in 2025.
These fuel (and hence, CO2 and fuel cost) savings will come from new communications, navigation, and surveillance (CNS) concepts like space-based automatic dependent surveillance-broadcast (ADS-B) surveillance, datalink or the sharing of all types of aeronautical information enabled by System Wide Information Management (SWIM). However, it is existing concepts that may provide some of the largest savings – with the efficiency improvements coming from the optimisation of horizontal flight efficiency (HFE) and vertical flight efficiency (VFE).
HFE and VFE
Free Route Airspace (FRA) is rapidly being implemented Europe-wide. It is estimated that when it is fully implemented by 2025, the estimates point to it providing 240,000 tonnes fuel savings/760,000 tonnes CO2 savings per year as airspace users are offered the chance to freely plan a route between any defined entry and exit point, subject to airspace availability. For optimising VFE in the en-route phase, flights should fly at their most efficient cruise level wherever possible. This will change as the flight progresses and is dependent on the rules and restrictions that apply in congested and fragmented airspace such as those in Europe. For optimising VFE in the climb and descent phases, however, efficiencies can be enhanced by flying Continuous Climb Operations (CCO) and Continuous Descent Operations (CDO), techniques that provide flight profiles that are optimised for minimum fuel burn and maximum environmental savings.
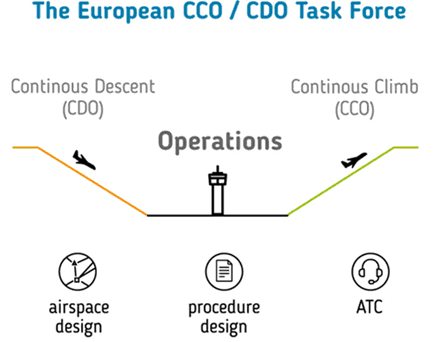
CCO and CDO
CCO and CDO are aircraft operating techniques that are enabled by optimum airspace and procedure design and facilitated by ATC. ICAO has developed two guidance manuals: ICAO Doc 9931 on CDO and ICAO Doc 9933 on CCO.
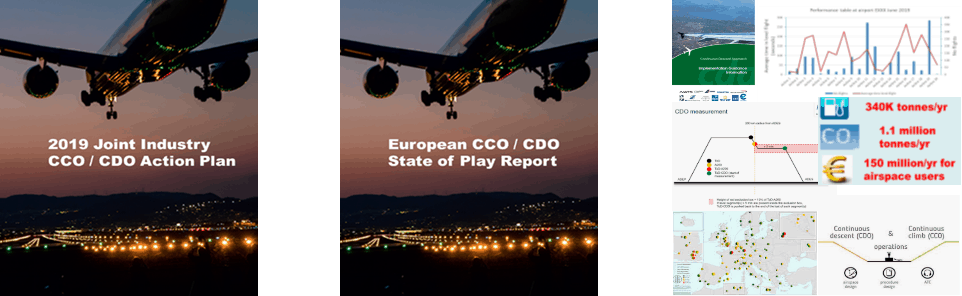
A European CCO/CDO Task Force has estimated that the planned implementation of these two ASBU modules in Europe, based on States’ deployment plans[2], will provide a large proportion of the environmental benefits attributed to ASBU. The optimisation of CCO and CDO to make the climb and descent profiles as efficient as possible, has been estimated to provide up to 350,000 tonnes fuel savings per year (approximately 1.1 million tonnes CO2 and up to 150 million EUR).
CCO and CDO are not rocket science procedures, they are basic pilot techniques. A “per definition” CDO descent is an unrestricted descent flown at idle power that would be flown all the time if an aircraft was the only aircraft in the sky. The problem is, in Europe, the aircraft is not alone in the sky! There are approximately 30,000 flights per day in Europe. With a standard 5nm separation, if all of these flights were airborne at once, they could all fit into an area smaller than the size of Romania. However, in reality, the complex interactions between arrival and departure routes and the need to manage multiple flows and dynamic restrictions, together with the fragmentation of air traffic services provision, means that European airspace remains densely flown, complex and with inherent inefficiencies that need to be addressed.
CCO and CDO in Europe have traditionally been lauded as the art of the possible which has ultimately led to sub-optimal performance of vertical flight efficiency in the climb and descent phases. Despite the Joint Industry Action plan and a set of supporting documentation developed a decade ago, CDO implementation and the associated benefits have not materialised as expected. Noise issues are best tackled by optimising CCO / CDO operations at lower levels. However, in order to generate the most possible fuel and CO2 savings, CCO and CDO should ideally be promoted for implementation from ground to top of climb (ToC) and from top of descent (ToD) to ground, whenever possible.
There is currently an enhanced awareness of the link between aviation emissions and climate change. Front pages of the media are dominated by the campaigns of School Strike for the climate, the #flygskam in Sweden, Greta Thunberg and the sit-ins by Extinction Rebellion amongst others, which, together with a “green surge” in the European Parliamentary elections in many States, are directing public attention more onto the sector. With the need to demonstrate that the aviation sector is pulling its weight, a focus on optimising the climb/descent profiles from ToD and to ToC to generate as much fuel and CO2 savings as possible has never been more apparent. For this to happen it is essential that ALL stakeholders work together and enable this performance improvement.
Measurement of CCO/CDO implementation
Part of the inability to create a large improvement in CDO implementation and generate the related savings is because previously, there was no a clear agreement of a ‘CDO implementation’ or harmonised criteria for measuring a CCO / CDO performance benefit. Whilst several stakeholders measure CDO performance at the local level, when these are based on different definitions or measurement criteria and results shared at the international level, this leads to confusion on the actual performance benefits. In addition, the vertical flight efficiency at the Pan-European level was not previously monitored leading to only a partial understanding of the network complexity and the potential for performance improvement.
European CCO/CDO Task Force
The European CCO / CDO Task Force has defined and developed, in association with European stakeholders, a harmonised set of definitions, metrics and parameters for harmonized CCO and CDO measurement at European level. These are all explained here.
The objective of the European CCO / CDO Task Force is to create a step-change in Pan-European CCO / CDO deployment. The Task Force is currently working on two key deliverables; the updated CCO / CDO Action Plan and the new CCO / CDO State of Play report which together with a website of resources relating to CCO and CDO, will form the toolkit for CDO / CDO implementation and optimisation in Europe. The Task Force would like to move forward a deployment programme for CCO / CDO enlisting a host of supporting airline, airport and ANSP best practice material to improve vertical flight efficiency in the climb and descent phases.
This tool kit will ultimately include:
- Details on the harmonised definitions, metrics and parameters for CCO / CDO measurement;
- Monthly CCO / CDO performance tables for all airports in Europe and all airlines flying in Europe;
- Harmonised AIP CDO structure and content;
- Best practice airspace and procedure design principles to be incorporated in the airspace design manual, the European Route Network Improvement Plan (ERNIP);
- ATCO training material on CDO together with ATCO CDO-related refresher training; and,
- Best practice material to be included in pilot training material, airline SOPs on CDO and CDO performance measurement.
One of the principal outcomes of the Task Force will be a proposal for monthly airport and airline CCO / CDO performance tables. The experiences of some airlines and ANSPs has already demonstrated that performance monitoring brings out performance improvements due to the Hawthorne effect – “the alteration of behaviour by the subjects of a study due to their awareness of being observed”. The idea of the performance tables is to share CDO-related performance information NOT to ‘name and shame’ but to ‘report and support’ those airports / ANSPs / airlines where CDO performance can be improved and to promote more optimal CDO-enabling best practices among ATCOs and pilots.
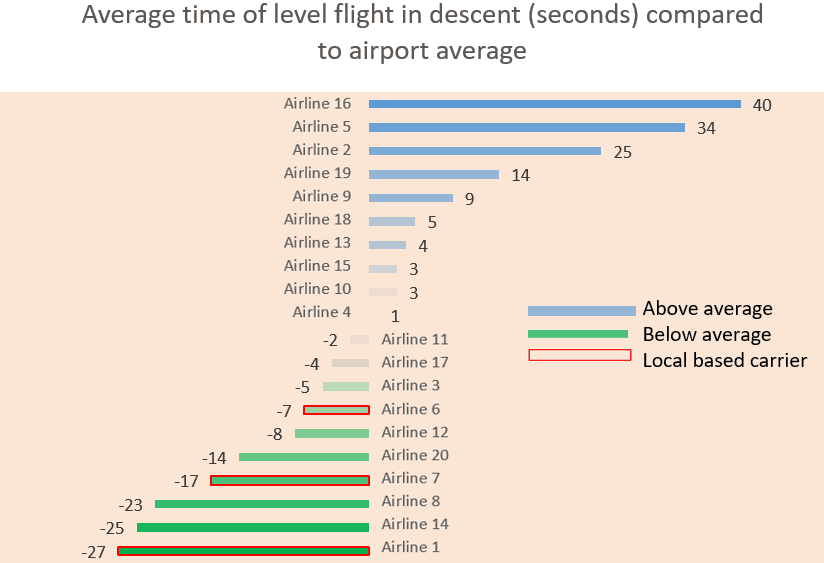
The basic functionality of the performance tables will be monthly CDO figures from the top of descent (CCO figures to top of the climb) for the airport/airline selected. Enhanced functionality will include the possibility to slice/aggregate by a/c type, country, alliance, type of flight, CCO / CDO, level band, time of analysis, etc. with vibrant charting possibilities (see below for just one example of what could be provided with basic functionality).
To access more information on this and other related subjects, see the Task Force webpages here.
About the Author
 David Brain previously worked as an Area Air Traffic Controller in the UK and has over 20 years extensive experience in ATC, ATM and Project Management. He currently leads EUROCONTROL’s environmental efforts on reducing aviation’s operational impacts and co-chairs the European CCO/CDO Taskforce as well as leading several other European operational projects.