The air transport industry is not only a vital engine of global socio-economic growth, but it is also of vital importance as a catalyst for economic development. Not only does the industry create direct and indirect employment and support tourism and local businesses, but it also stimulates foreign investment and international trade.
Informed decision-making is the foundation upon which successful businesses are built. In a fast-growing industry like aviation, planners and investors require the most comprehensive, up-to-date, and reliable data. ICAO’s aviation data/statistics programme provides accurate, reliable and consistent aviation data so that States, international organizations, aviation industry, tourism and other stakeholders can:
- make better projections;
- control costs and risks;
- improve business valuations; and
- benchmark performance.
The UN recognized ICAO as the central agency responsible for the collection, analysis, publication, standardization, improvement and dissemination of statistics pertaining to civil aviation. Because of its status as a UN specialized agency, ICAO remains independent from outside influences and is committed to consistently offering comprehensive and objective data. Every month ICAO produces this Air Transport Monitor, a monthly snapshot and analysis of the economic and aviation indicators.
ECONOMIC DEVELOPMENT – May 2020
World Results and Analyses for March 2020
Total Scheduled Services (Domestic and International)
Passenger traffic

Revenue Passenger-Kilometres – RPK
World passenger traffic fell by -52.9% YoY in March 2020, -38.8 percentage points lower than the decline in the previous month. This abrupt slump has far exceeded the level seen in the aftermath of 9/11. Global air travel demand was heavily impacted by the stringent travel restriction imposed by governments to contain the COVID-19 spread. All regions contributed negatively to the traffic result, with the most precipitous contraction in Asia/Pacific and Europe. China continued to be the weakest performing domestic market, followed by Japan and United States.
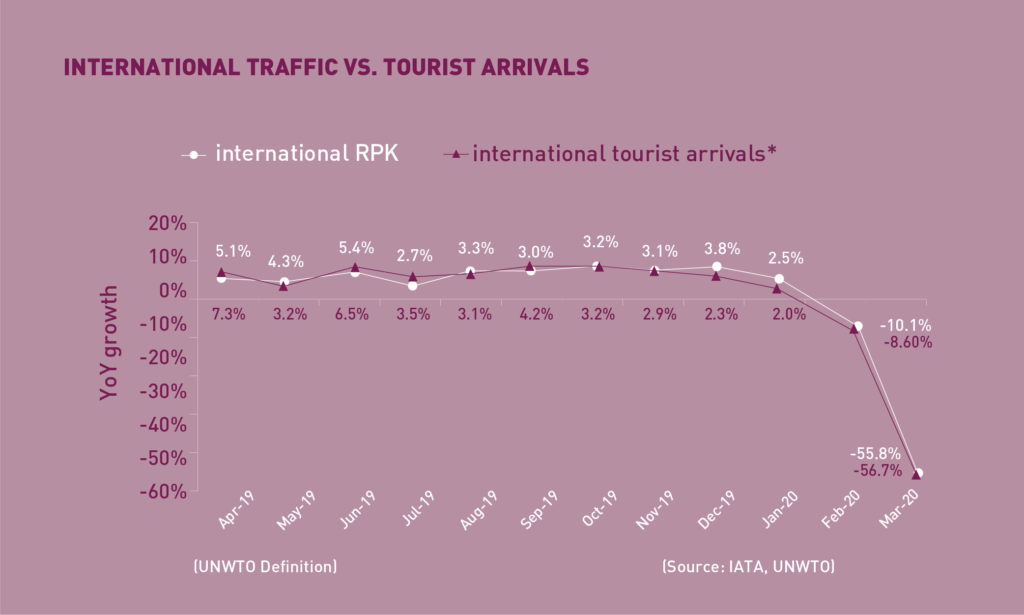
International Traffic vs. Tourist Arrivals
International passenger traffic fell by -55.8% YoY in March 2020, -45.7 percentage points lower than the decline in the previous month. Traffic in all regions plunged owing to the drastic drop in demand amplified by the travel restrictions and border closure. The international tourist arrivals followed a similar trend as international passenger traffic and declined sharply.
Capacity

Available Seat-Kilometres – ASK
Capacity worldwide fell by -36.2% YoY in March 2020, -27.5 percentage points lower than the decline in the previous month (-8.7%). With the growing spread of the COVID-19 outbreak and extension to a global pandemic, world capacity is expected to further reduce by -83.7% in April 2020.
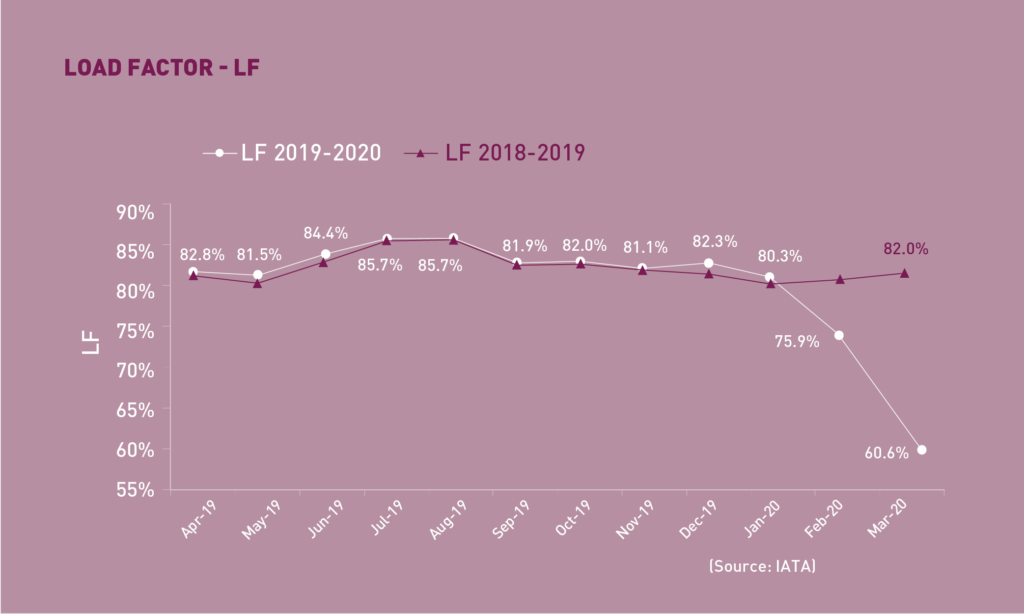
Load Factor
The passenger Load Factor fell to 60.6% in March 2020, -15.3 percentage points lower than the previous month. As the decline in traffic demand was far greater than capacity reduction, the March LF was -21.4 percentage points lower compared to the rate in the same period of 2019.
Freight Traffic
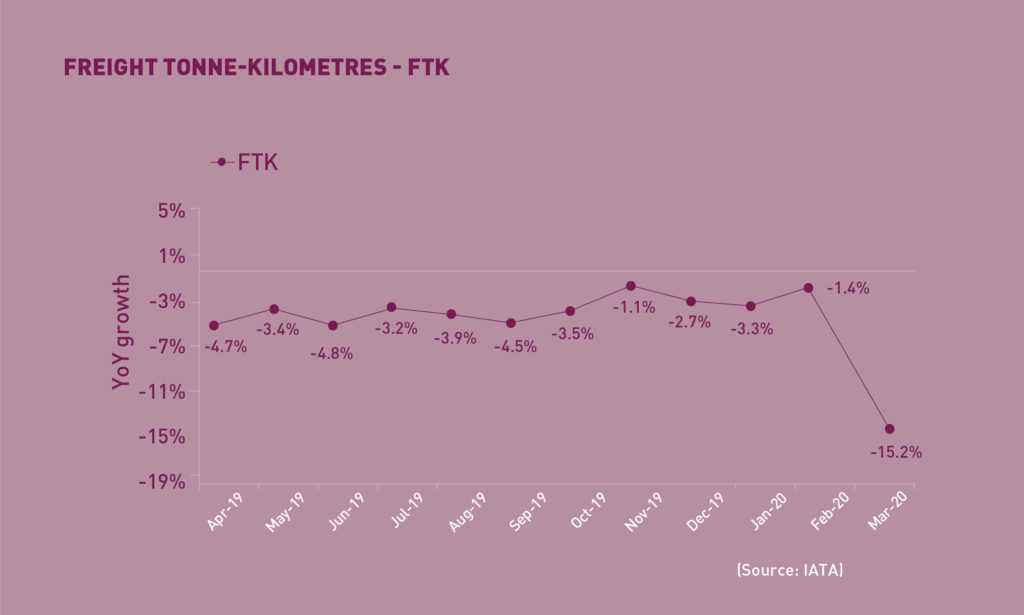
Freight Tonne-Kilometres – FTK
World freight traffic reported a decline of -15.2% YoY in March 2020, -13.8 percentage points lower than the fall in the previous month, reaching 12 consecutive months of negative YoY growth for 12 consecutive months. Building on the weaker freight demand due to the trade tensions, the widespread of COVID-19 across all regions further deteriorated the freight traffic result. The fall in freight demand, however, was notably slower than the pace of passenger traffic decline, mainly due to the need for transportation of medical supplies and other essential goods. The increase in all-freighters and cargo-only operations using passenger aircraft has offset the reduction in belly cargo capacity.
Top 15 Airports (Ranked by aircraft departures, passengers and volume of freight)
Note: Figures include total scheduled and non-scheduled services
March 2020: -15.7%, -49.8%, and -8.1% YoY in terms of aircraft departures, passengers and freight for the Top 15
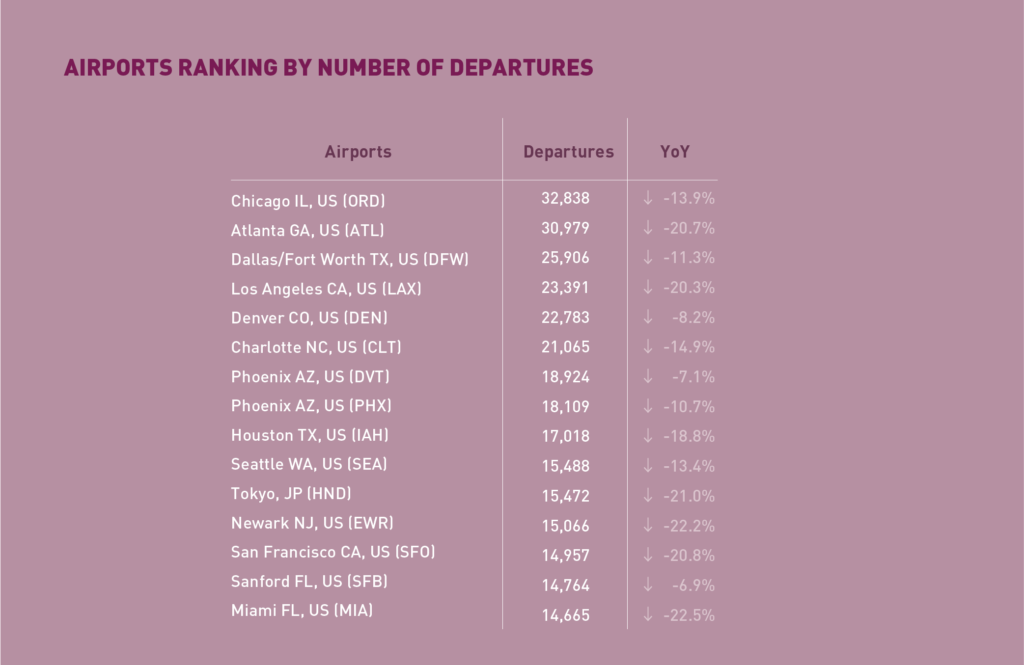
In terms of aircraft departures, all the Top 15 airports reported declines with a combined fall of -15.7% YoY.
Due to the COVID-19 impact, several major airports disappeared from the Top 15 ranking. Except Tokyo,
all the other Top 15 were US airports. Chicago remained at 1st with a decline of -13.9%, followed by
Atlanta at -20.7%.
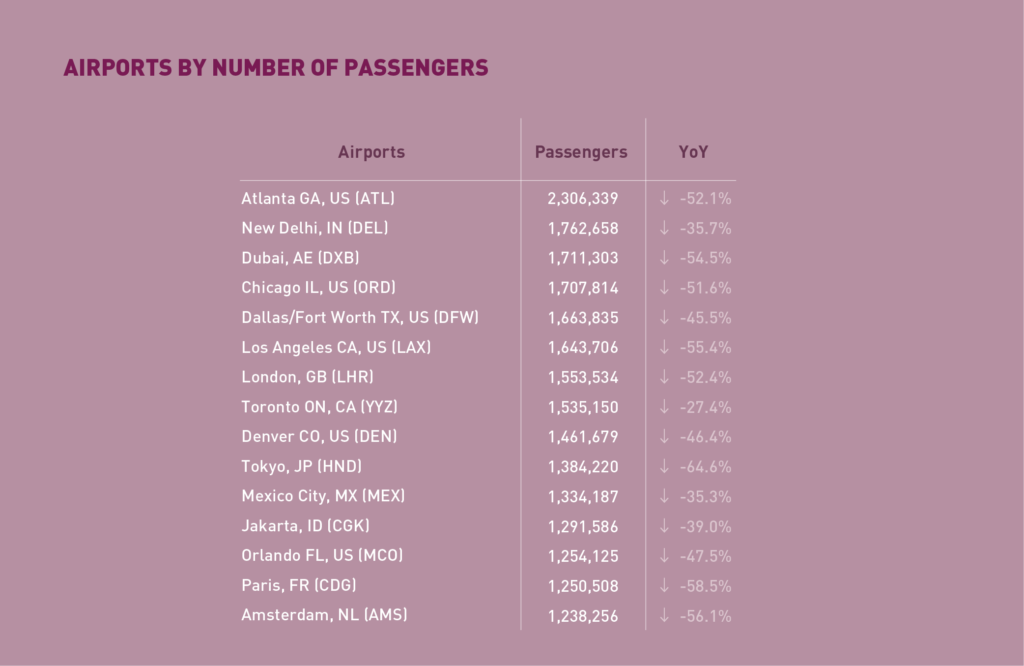
In terms of passengers, the Top 15 airports plunged by -49.8% YoY with passenger numbers in most of the major hubs more than halved. Airports in China remained being impacted the most and did not rank within Top 15. Atlanta remained at 1st albeit with a stark decline of -52.1%. Followed was New Delhi with a relatively less severe drop of -35.7%. The most significant fall was recorded by Tokyo at -64.6%.

In terms of freight, the Top 15 airports reported a decline of -8.1% YoY, much slower than the pace of passenger traffic fall, owing to the increased operation in all-freighter and cargo-only operations. Hong Kong remained at 1st despite down by -11.2%. The sharpest fall was recorded in Dubai with -32.2%, followed by Singapore (-19.2%).
Top 15 Airline Groups (Ranked by RPK)
 March 2020: -51.7% YoY in terms of RPK for the top 15
In terms of RPK, the Top 15 airline groups accounted for 47.4% of the world’s total RPK in March 2020 and declined by -51.7% YoY. This decline was +1.2 percentage points less than the world’s average on scheduled services, with contraction in traffic of all airlines in the Top 15. Ranking of the Top 15 airlines was distorted due to the different phase of impact of COVID-19 by region and State.
United went up 2 positions to 1st albeit with a decline of -54.3%, followed by American and Delta contracting by -53.8% and -58.0%, respectively. Southwest fell by -54.9% and ranked down to 9th. With a decline of -50.2%, Air Canada went down to 14th. Emirates tumbled by -48.0% and maintained its position at 4th. Qatar Airways lifted 1 position to 8th with a fall of -37.0%.
IAG and Lufthansa ranked up to 5th and 6th with -43.6% and -50.1% decline, respectively. AF-KLM fell sharply by -50.6%, and went down 2 positions to 7th. Aeroflot appeared in the Top 15 and ranked 10th with a fall of -37.4%. Ryanair ranked down to 11th with a decline of -48.8%. With traffic more than halved, Turkish Airlines went down 4 positions to 15th. China Southern experienced the most precipitous decline with over two-thirds of its traffic evaporated. The airline, however, made it back to the Top 15 and ranked 13th. LATAM remained at
12th with a fall of -37.9%.
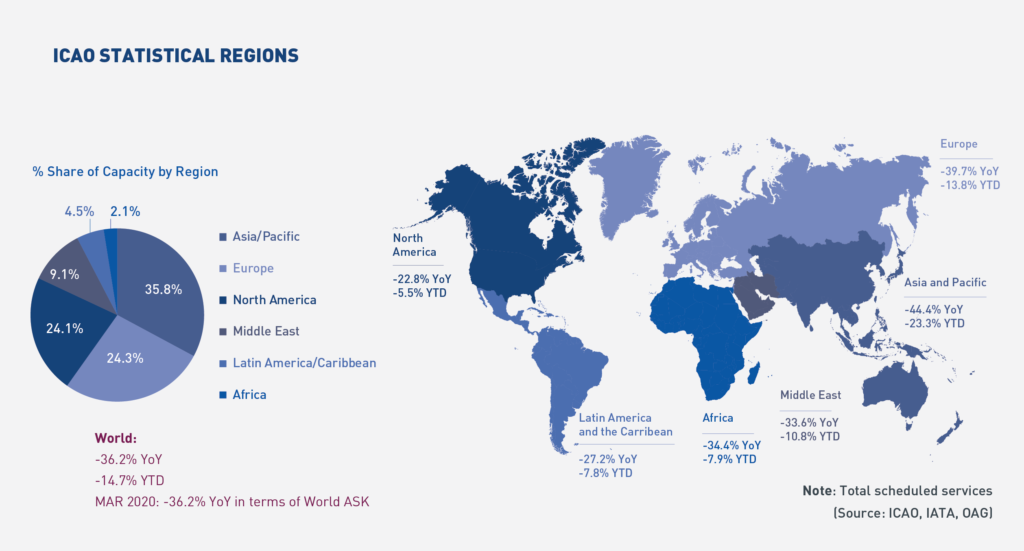
Worldwide capacity contracted by -36.2% YoY in March 2020. The decline in world capacity was driven by the drastic capacity reduction in all regions amidst the COVID-19 outbreak, most notably in Asia/Pacific and Europe. Global capacity is expected to further shrink in the coming month as States geared up to contain the pandemic enforcing stringent travel restrictions and border closure.
Acronyms: ACI: Airports Council International; ASK: Available Seat-Kilometres; IATA: International Air Transport Association; FTK: Freight Tonne-Kilometres; LF: Passenger Load Factor;
OAG: Official Airline Guide; RPK: Revenue Passenger-Kilometres; UNWTO: World Tourism Organization; YoY: Year-on-year; YTD: Year-to-date.