The air transport industry is not only a vital engine of global socio-economic growth, but it is also of vital importance as a catalyst for economic development. Not only does the industry create direct and indirect employment and support tourism and local businesses, but it also stimulates foreign investment and international trade.
Informed decision-making is the foundation upon which successful businesses are built. In a fast-growing industry like aviation, planners and investors require the most comprehensive, up-to-date, and reliable data. ICAO’s aviation data/statistics programme provides accurate, reliable and consistent aviation data so that States, international organizations, aviation industry, tourism and other stakeholders can:
-
- make better projections;
- control costs and risks;
- improve business valuations; and
- benchmark performance.
The UN recognized ICAO as the central agency responsible for the collection, analysis, publication, standardization, improvement and dissemination of statistics pertaining to civil aviation. Because of its status as a UN specialized agency, ICAO remains independent from outside influences and is committed to consistently offering comprehensive and objective data. Every month ICAO produces this Air Transport Monitor, a monthly snapshot and analysis of the economic and aviation indicators.
ECONOMIC DEVELOPMENT – December 2019
World Results and Analyses for October 2019
Total Scheduled Services (Domestic and International)
![]()
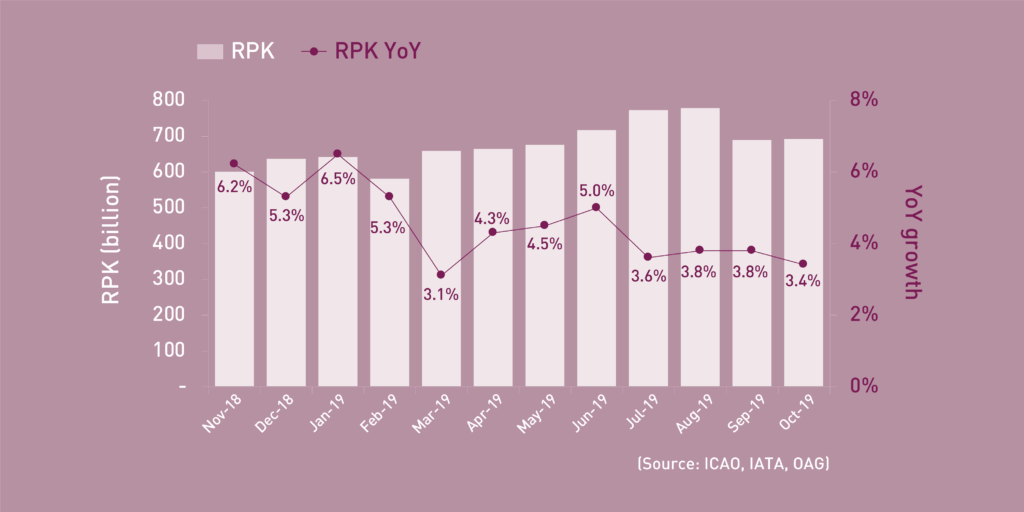
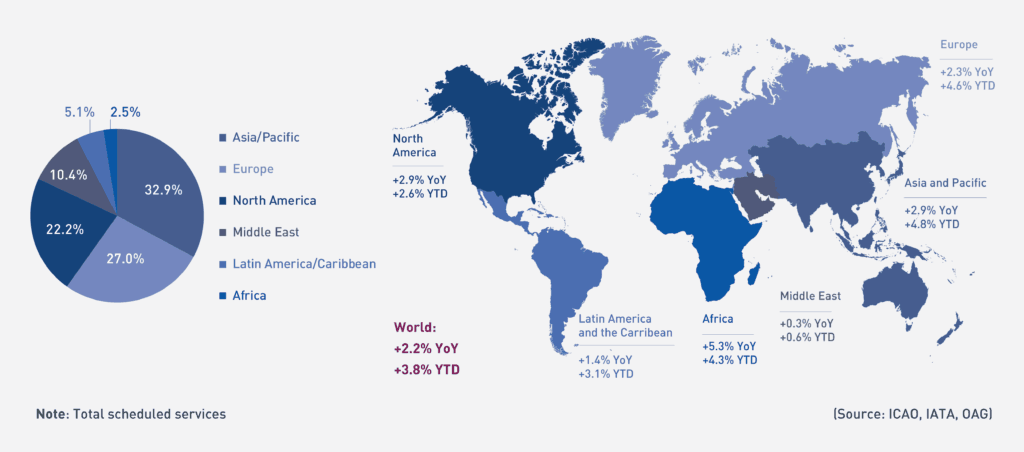
Revenue Passenger-Kilometres – RPK
World passenger traffic grew by +3.4% YoY in October 2019, -0.4 percentage point lower than the growth in the previous month. All regions, except for Africa and the Middle East, posted a slowdown with Asia Pacific experiencing the most significant deceleration. The Middle East accelerated traffic growth notably and became the fastest-growing region. Domestic traffic demand eased at the worldwide level with softening in the top domestic markets such as China and India.
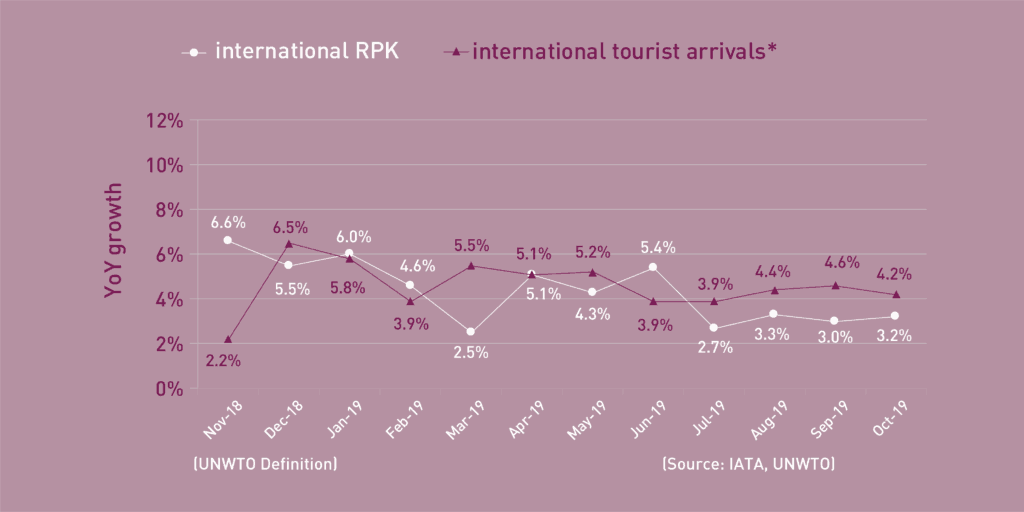
International Traffic vs. Tourist Arrivals
International passenger traffic grew by +3.2% YoY in October 2019, +0.2 percentage point higher than the growth in the previous month. Three regions recorded an acceleration in traffic growth with the strongest pick-up in the Middle East. Latin America/Caribbean posted the weakest performance and became the only region with negative growth. The growth of international tourist arrivals* remained relatively stable.
![]()
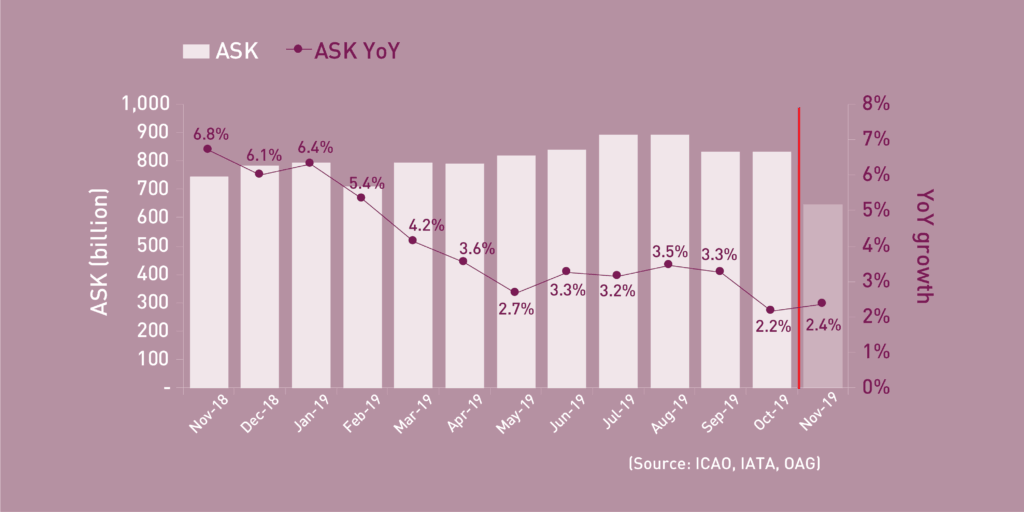
Available Seat-Kilometres – ASK
Capacity worldwide increased by +2.2% YoY in October 2019, -1.1 percentage points lower than the growth in the previous month (+3.3%). According to the airline schedules, capacity expansion is expected to be around +2.4% in November 2019.
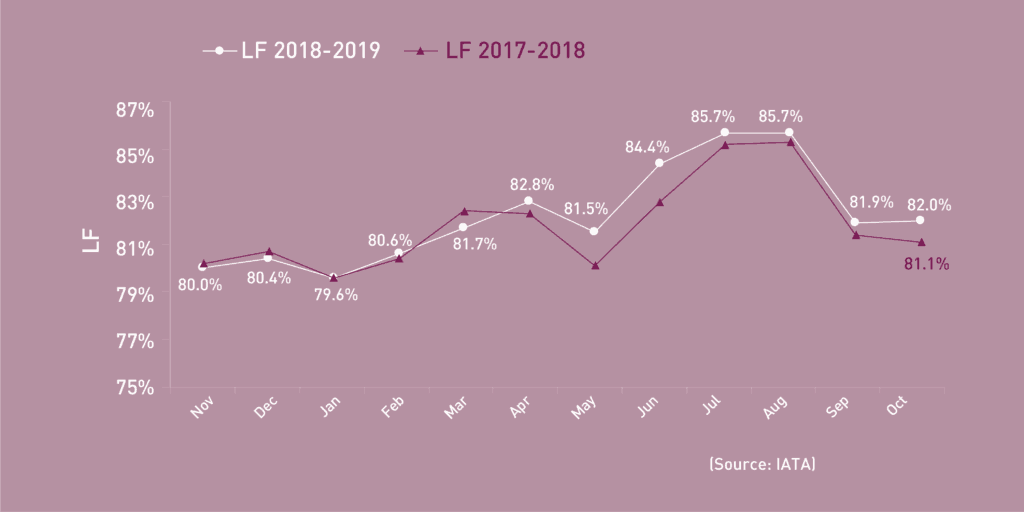
Load Factor – LF
The passenger Load Factor reached 82.0% in October 2019, +0.1 percentage point higher than the previous month. As traffic growth outpaced the capacity expansion, the October LF was +0.9 percentage point higher compared to the rate in the same period of 2018.
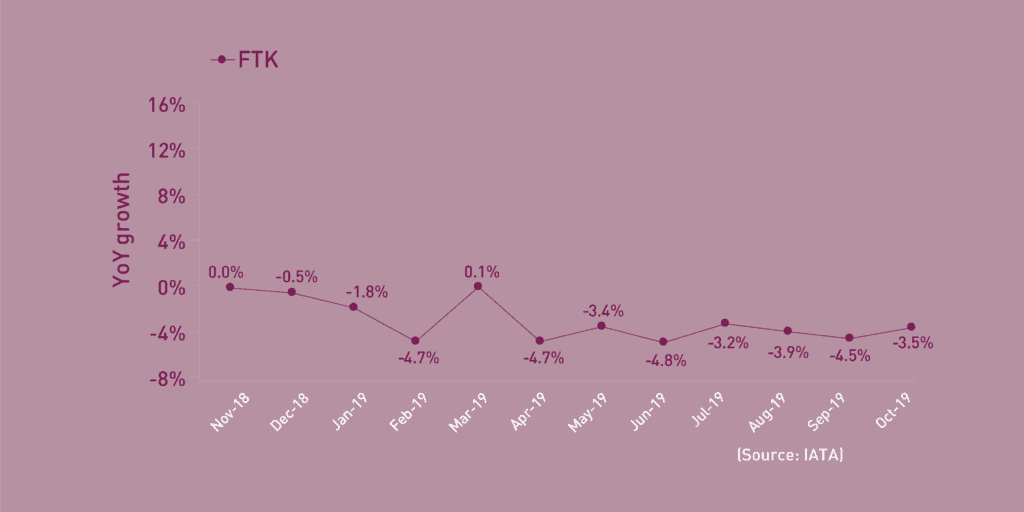
Freight Tonne-Kilometres – FTK
World freight traffic reported a decline of -3.5% YoY in October 2019, +1.0 percentage point higher than the growth in the previous month. Albeit with marginal improvement in certain regions, freight traffic demand remained weak worldwide with consecutive negative growth over the last seven months. This weakness reflected the sluggish global trade development. Africa continued to be the only region growing positively and increased the momentum with a surge of double-digit growth. For the sixth month this year, the Middle East was the weakest performing region, followed by Asia/Pacific and Latin America/Caribbean.

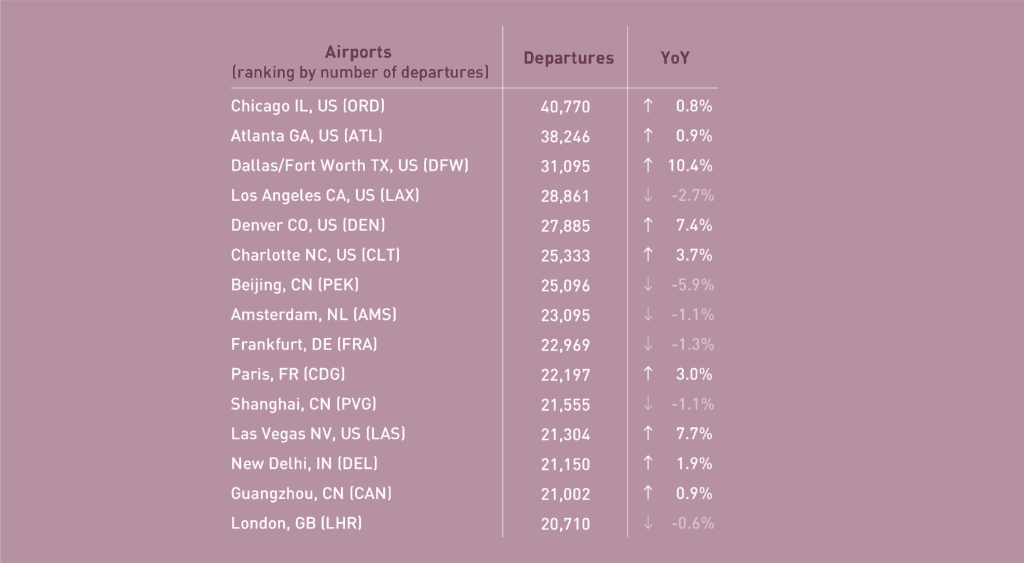
In terms of aircraft departures, the Top 15 airports reported a growth of +1.5% YoY. Nine out of the Top 15 airports posted YoY increases. Chicago ranked 1st with a marginal growth of +0.8%. The strongest growth in operations was recorded by Dallas/Fort Worth at +10.4%, followed by Las Vegas at +7.7%.
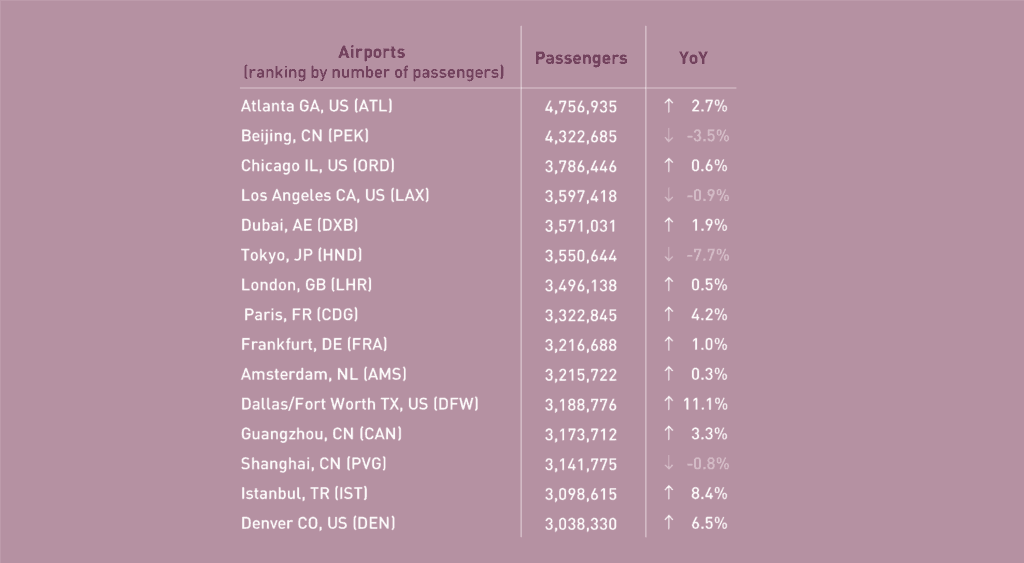
In terms of passengers, the Top 15 airports reported a growth of +1.4% YoY. Eleven out of the Top 15 airports posted YoY increases. Atlanta remained at 1st with a growth of +2.7%, followed by Beijing. Dallas/Fort Worth recorded the most significant growth at +11.1%. Decline was observed in major hubs in Asia/Pacific with -7.7% and -3.5% fall in Tokyo and Beijing, respectively.
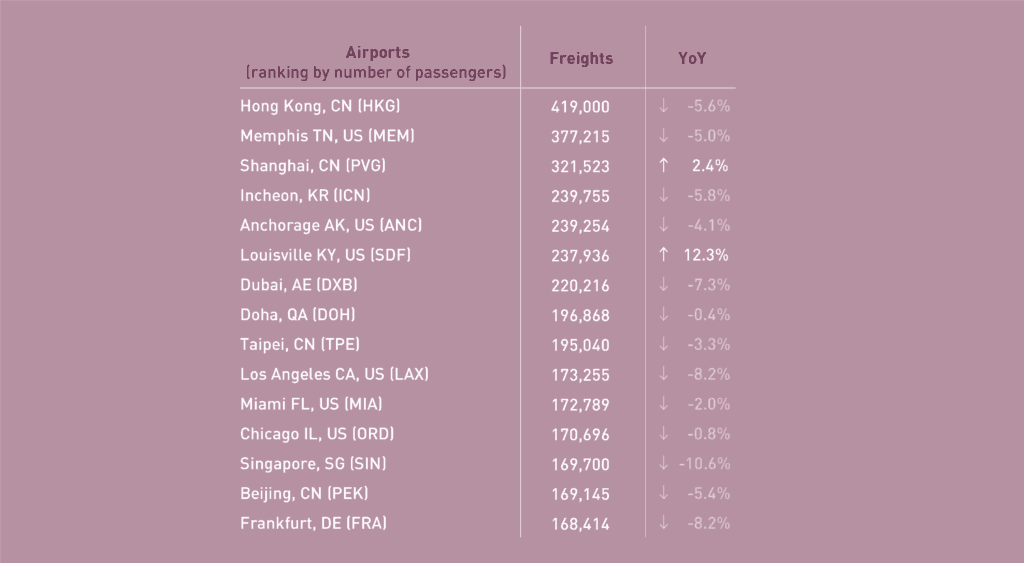
In terms of freight, the Top 15 airports reported a decline of -3.5% YoY. All the Top 15 airports posted declines except for Louisville (+12.3%) and Shanghai (+2.4%). The former continued to record the highest growth supported by its UPS hub position. The most significant decrease was posted by Singapore at -10.6%, followed by both Frankfurt and Los Angeles at -8.2%.
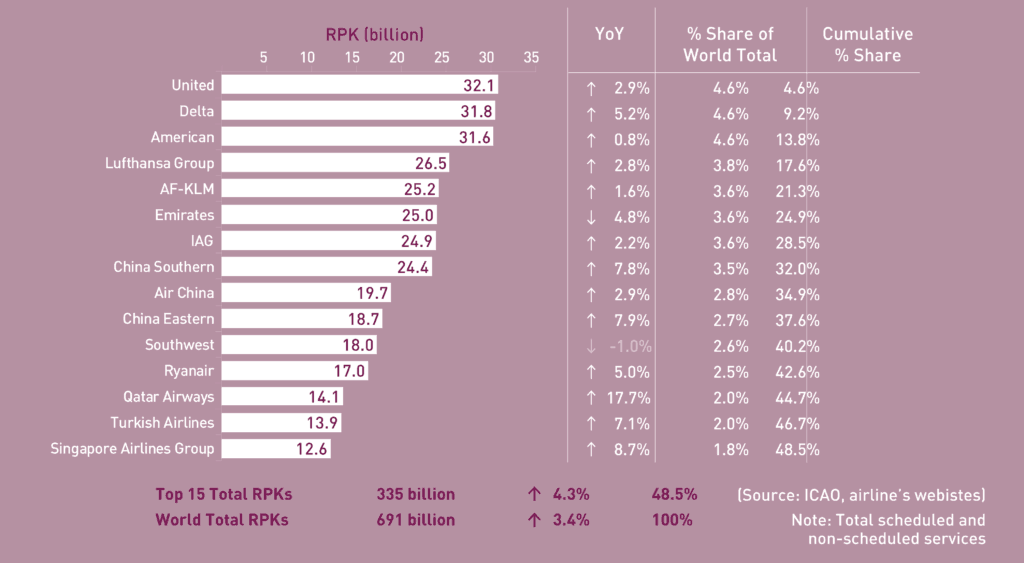
October 2019: +4.3% YoY in terms of RPK for the Top 15 airlines
In terms of RPK, the Top 15 airline groups accounted for 48.5% of the world’s total RPK in October 2019 and grew by +4.3% YoY. This growth was +0.9 percentage point higher than the world’s average on scheduled services. Fourteen out of the Top 15 airline groups posted YoY growth.
United ranked 1st with moderate growth of +2.9%, followed closely by Delta which grew at +5.2%. American grew merely at +0.8% and dropped by 1 position to the 3rd. Southwest went up one position to 11th, albeit with a decline of -1.0%.
Emirates dropped one position to 7th with a growth of +2.2%. Qatar Airways recorded the fastest growth among the Top 15 with an increase of +17.7% while remained at 13th.
Lufthansa and AF-KLM maintained their positions at 4th and 5th while growing modestly at +2.8% and +1.6%, respectively. IAG grew at +4.8% and went up one position to 6th. Ryanair posted a relatively slower pace compared to the previous month at +5.0% and dropped by one position to 12th. Turkish Airlines recorded a solid growth at +7.1% and remained at 14th.
China Southern, Air China and China Eastern retained their position of 8th, 9th and 10th with growth of +7.8%, +2.9% and +7.9%, respectively. Singapore Airlines recorded the second-highest growth among the Top 15 and ranked 15th.
Worldwide capacity expanded by +2.2% YoY in October 2019. Three regions recorded acceleration in capacity expansion while notable slowdown was posted by Asia/Pacific followed by Europe, resulting in the overall deceleration of the world total capacity.
Africa became the fastest expanding region. For the second consecutive time, the Middle East was the slowest growing region.
Acronyms: ACI: Airports Council International; ASK: Available Seat-Kilometres; IATA: International Air Transport Association; FTK: Freight Tonne-Kilometres; LF: Passenger Load Factor;
OAG: Official Airline Guide; RPK: Revenue Passenger-Kilometres; UNWTO: World Tourism Organization; YoY: Year-on-year; YTD: Year-to-date.